PX4 development - building, flashing and debugging with debugger (like a PRO)
This is the next tutorial that brings a bit more expertise into PX4 Autopilot debugging from an embedded software developer perspective. It will explain how to use J-Link debugger to debug PX4 Autopilot code in Eclipse IDE.
If you didn't already see the previous tutorial, please go there, first phase of PREPARING is mandatory to be done so we can continue here.
Link to previous tutorial:
https://igor-misic.blogspot.com/2022/06/px4-development-building-flashing-and.html
Everything in this tutorial is tested and reproduced at Kubuntu 22.04 LTS (It works the same for Ubuntu as well).
Eclipse IDE
Build config
We will install Eclipse and configure everything manually to be able to use inline debugging and brake points.
Let's start with downloading Eclipse IDE for Embedded C/C++ Developers.
PX4 uses Makefile as the primary building procedure. That means that inside Eclipse we need to create a new 'Makefile Project with Existing Code' for our PX4 Autopilot project.
Write the name of the project, select code location, and select 'Arm Cross GCC' as it is shown in figure 3.
Now we need to configure the newly created project.
Right-click on the newly created project and select 'Properties' like it is shown in figure 4.
In Builder Settings tab for build command set make.
In 'Behavior' tab enable parallel build and for 'Workbench Build Behavior' write DO_NOTHING. This will prevent accidents of building firmware for all boards. We want to build firmware only for specific boards we are working on.
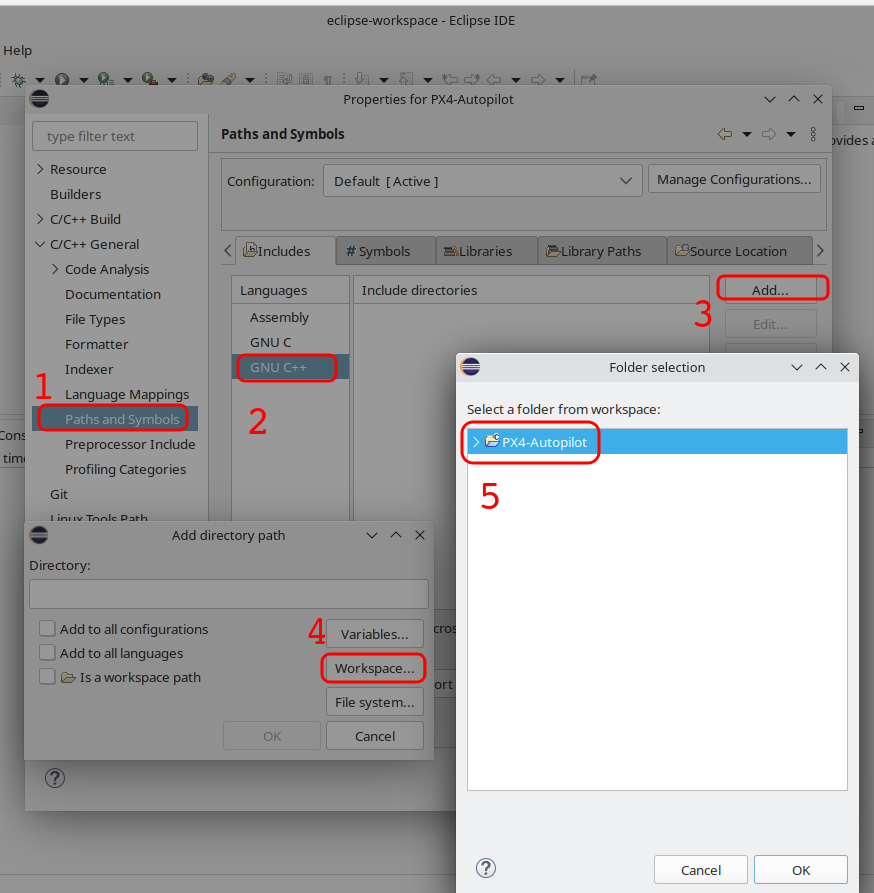
To enable code indexing we need to add a code path. Do it both for 'GNU C' and 'GNU C++'.
Now we can create custom 'Build Targets'.
You can also add 'clean' for build cleaning, and 'format' for the AStyle code formatting.
The first format run should be done over the console with 'make format' since it will ask you to create a git hook file and you will need to accept it.
Now you can create firmware for any target with a double click.
Debug config
It is time to set up the configuration for debugging.
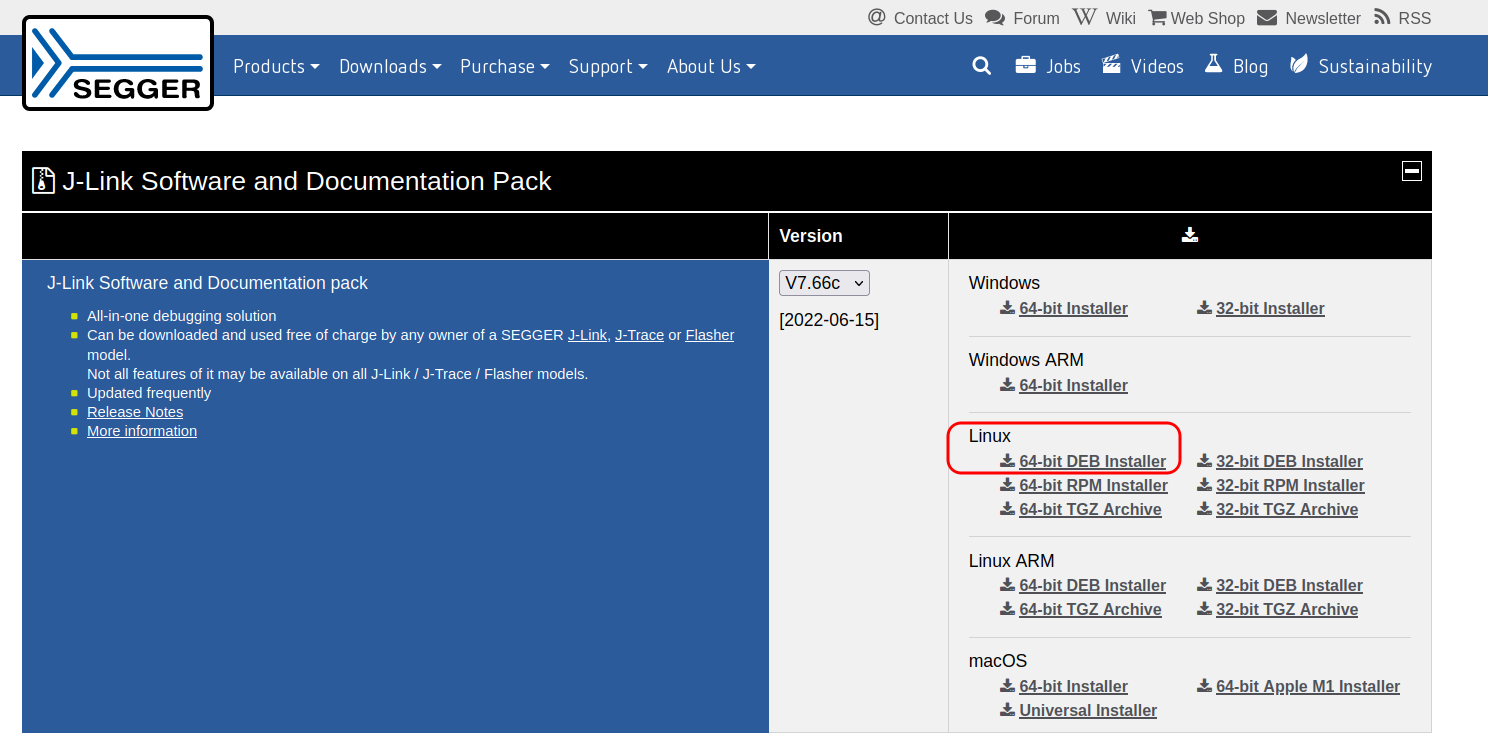
Download and install Segger J-Link software. Current version ended up installed in path /opt/SEGGER/JLink_V766c . We will need this latter.
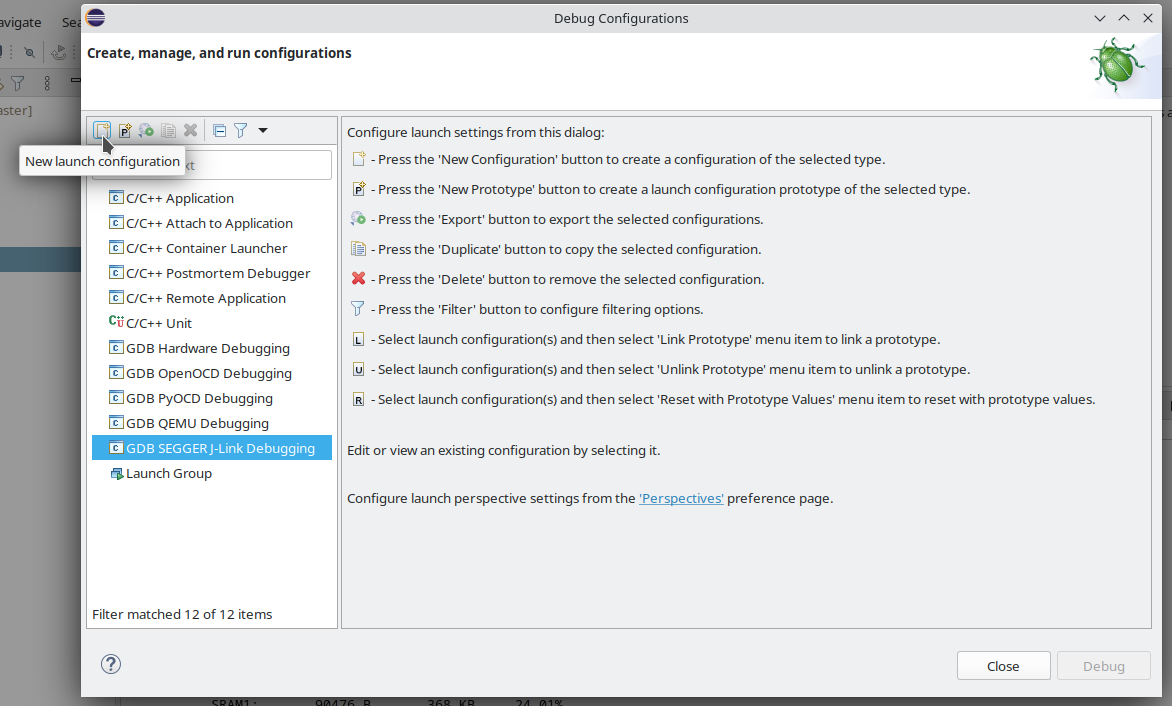
Go to menu for 'Debug Configuration'.
Select new 'GDB SEGGER J-Link Debugging'
Select file elf file we were previously build.
Disable auto build, we are manually building target when it is needed.
Move to 'Debugger' tab. Make sure 'Actual executable' path is correct for J-Link.
'Device name' shall be name of microcontroller. It should exist on the list at this Segger page
https://www.segger.com/downloads/supported-devices.php
Some common microcontrollers for PX4 boards:
px4_fmu-v4 - STM32F427II (Pixracer)
px4_fmu-v5 - STM32F765II (Pixhawk)
px4_fmu-v5x - STM32F765II
px4_fmu-v6x - STM32H753II
In 'GDB Client Setup' change 'Exacutable name' from 'gdb' to 'arm-none-eabi-gdb'.
In 'Startup' tab I found out that 'Enable SWO CPU freq' should be disabled for STM32F765II microcontroller. For other works when it is enabled.
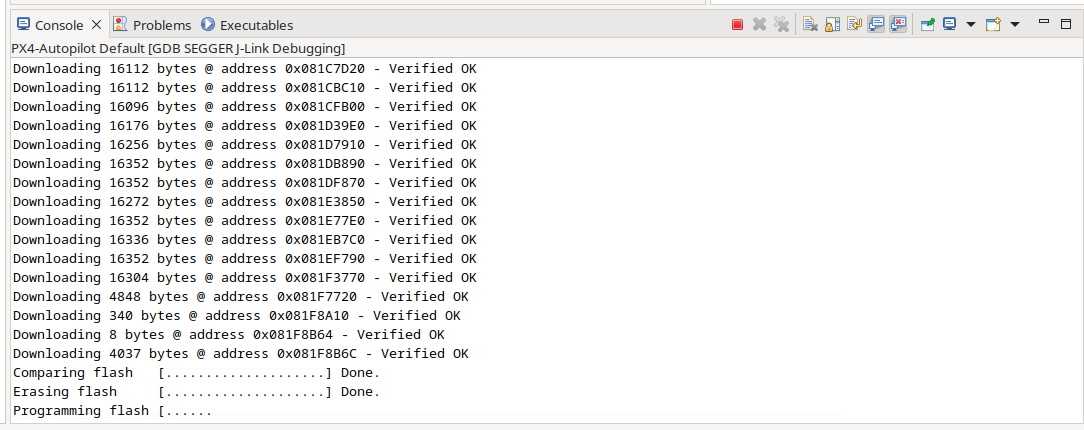
We can now start debugging. It will flash elf file to the target.
If configuration was proper you will see flashing process.
And that is it. We are ready to start using brakepoints, 'step in' and 'step over' buttons.
Conclusion
This type of debugging will help you to faster catch the error. You will be able to flash and test your changes with the single click.Enjoy your development and debugging.
If you find this useful you can consider to buy me a coffee

More about author: https://imtech.hr/


Comments
Post a Comment